Superior Forecast Quality improves customer satisfaction, reduces inventory costs and drives higher margins. Valizant’s Forecast Variability Analysis model example showcase how your organization can achieve better forecast quality.
This model example is showcase the art of the possible. Our configurable Application found here are fully supported and accelerates your journey to the connected enterprise.
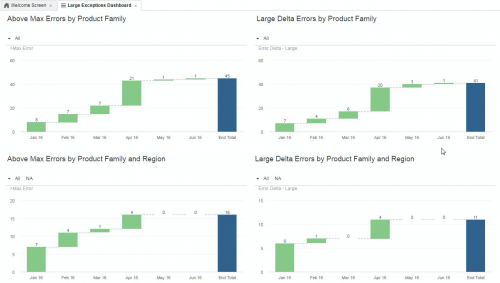
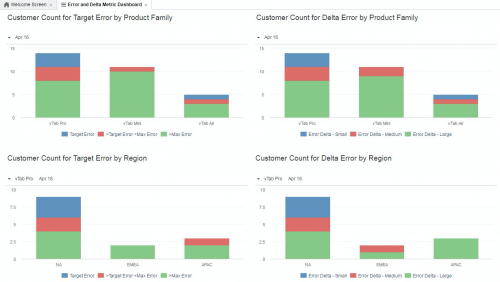
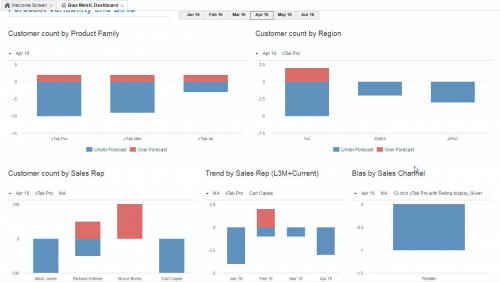
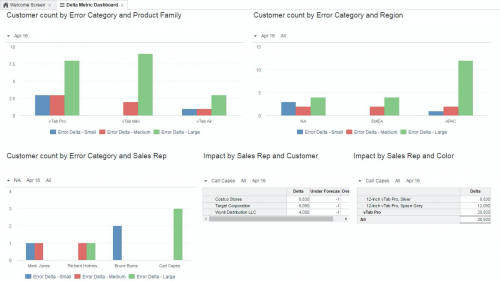
With this model example, you can set clear and unambiguous forecast quality goals at your organization. You can align your teams to these goals in clear terms that they relate to. You also get a live picture of Forecast Quality on the go and understand how forecast varies by Teams, by Products, by Regions and by a combination of all these, at different levels of detail. Most importantly, this model helps you quickly interpret impact of Forecast quality on your business and act on time with precision.
Information
Size
26.7 MB
Language
English
Stats
Modules
14
Roles
2
Formulas
77
Reports
5
Complexity
Intermediate
termsTitle

